
An enterprise SEO dashboard segments performance by location, service line, and business unit, then ties that data directly to revenue through CRM and call tracking. Standard tools roll everything into one number. Enterprise dashboards show exactly which markets are winning and which ones need attention.
0:00 Enterprise SEO Dashboards: Real Numbers, Real Revenue
0:25 Who this is for
0:44 The Core Problem with Standard Dashboards
1:13 Segmented Dashboards Find Opportunities Faster
1:41 What Enterprise Dashboards Actually Segment
2:15 Four Core Metrics Enterprise Dashboards Track
2:40 Organic Leads vs. Paid: The Cost Argument
3:07 Four Foundational Dashboard Components
3:42 Call Tracking Drives Attribution Accuracy
4:11 Technical SEO Dashboard: What to Monitor
4:52 Tool Selection: Match Complexity to Need
5:32 Franchise Dashboards: Location-First Hierarchy
6:03 Local Search Converts Fast — Track It
6:38 Small Business vs. Enterprise Dashboard
7:12 Build Sequence: Client Dashboard Setup
7:49 Executive View: What Leadership Actually Needs
8:26 Maintenance: Four to Six Hours Per Client Monthly
8:60 Timeline to Build Enterprise Dashboard Right
9:42 Stop Hiding Behind Blended Averages
Full transcript
0:00 Enterprise SEO Dashboards: Real Numbers, Real Revenue
Your SEO reports are probably lying to you — not because the numbers are wrong, but because they are all blended into one. In this video, we are walking through exactly how enterprise SEO dashboards work, why segmentation is the only thing that matters, and how to build a system that connects organic search directly to closed revenue. This is the PushLeads guide to enterprise SEO dashboards.
0:44 The Core Problem with Standard Dashboards
Here is the core problem. Your Phoenix location just dropped from position three to position twelve. Your Denver location climbed to number one. Your dashboard shows steady traffic. Everything looks fine. This is what blended data does — it hides catastrophic market-level shifts behind an average that feels reassuring. The challenge is not how much data you have. It is whether that data is segmented by location, service line, and business unit.
1:13 Segmented Dashboards Find Opportunities Faster
Companies using segmented performance dashboards identify growth opportunities forty-seven percent more effectively than those relying on consolidated data alone. For an SEO program managing millions in revenue, forty-seven percent is not a marginal improvement. That is the difference between knowing exactly which market to push budget into this quarter and guessing based on a blended number that obscures everything underneath it.
1:41 What Enterprise Dashboards Actually Segment
So what does an enterprise dashboard actually segment? First — location. Position three in Asheville, North Carolina carries a completely different revenue implication than position three in a rural market with a fraction of the search volume. Second — service line. A water damage restoration company might see commercial jobs declining while residential jobs climb. Blended totals keep both trends invisible. Third — business unit. Each unit has different conversion paths and customer values that a single view simply cannot reflect.
2:15 Four Core Metrics Enterprise Dashboards Track
There are four metric categories every enterprise dashboard must track. Location-level rank tracking tied to geographic coordinates using tools like BrightLocal or Local Falcon. Conversion data by market showing which locations produce the most organic leads. Revenue attribution through CRM integration — this is what answers the CFO question at the end of every quarter. And competitive share of voice by location, not just overall domain authority or link profile.
2:40 Organic Leads vs. Paid: The Cost Argument
Here is the revenue argument that wins executive buy-in every time. Organic leads cost forty percent less than paid leads. And they close at a higher rate. When your dashboard connects organic traffic to pipeline value and closed deals, the conversation stops being about SEO cost and starts being about where to invest more. That shift happens only when the data architecture is built to support it from day one.
3:07 Four Foundational Dashboard Components
A properly built enterprise dashboard rests on four foundational components. Location-specific rank tracking — coordinates, not national averages. Multi-system data integration pulling from GA four, Search Console, call tracking, CRM, and franchise management software. Custom attribution models built for complex sales paths where a commercial client calls an eight-hundred number and closes a job weeks later. And automated anomaly detection that fires the same day traffic drops twenty percent — not during the next monthly report.
3:42 Call Tracking Drives Attribution Accuracy
Call tracking is not optional for enterprise local SEO reporting — it is the core of revenue attribution. Businesses using attribution-connected call tracking see a twenty-eight percent improvement in ROI measurement compared to tracking call volume alone. Configure separate dynamic number insertion pools for each location using CallRail or CallTrackingMetrics. Map every answered call, every booked job, and every qualified lead back to the organic session and keyword that generated it.
4:11 Technical SEO Dashboard: What to Monitor
Your technical SEO dashboard needs to catch problems before they cost rankings. That means three things running continuously. Crawl coverage and indexation rates by site section — flag gaps that signal crawl budget problems. Core Web Vitals by page template, not site-wide averages — a slow category template affects thousands of URLs at once. And redirect chain depth across the entire site — chains longer than two hops waste crawl budget and dilute link equity. According to Search Engine Land, sites that catch and resolve technical issues within forty-eight hours recover rankings significantly faster than those that find problems only during monthly reporting cycles.
4:52 Tool Selection: Match Complexity to Need
Choosing the right tool means matching complexity to your actual requirements. Google Looker Studio handles most enterprise reporting needs for free — it connects natively to GA four, Search Console, Google Ads, and Google Business Profiles. BigQuery steps in when you need to combine SEO data with CRM platforms or franchise management systems before it flows into Looker Studio. BrightEdge and Conductor are purpose-built for very large programs at several thousand dollars per month. Tableau and Power BI serve organizations with data scientists on staff. Start simple. Add complexity only when the data requires it.
5:32 Franchise Dashboards: Location-First Hierarchy
Franchise reporting requires a location-first hierarchy, and it requires two completely separate views built from the same underlying data. The franchisee view filters automatically to their single location — their rankings, their calls, their conversions benchmarked against the system average. The franchisor view shows every location in a sortable comparison table with regional rollups and market share trends across the full system. Neither group should have to dig through numbers that do not apply to their role.
6:03 Local Search Converts Fast — Track It
Small businesses need specificity, not complexity. A single-location plumber does not need a BigQuery pipeline. They need to see how many calls came from organic search this month, which keywords drove those calls, and how their Google Business Profile rankings changed in their service area. According to BrightLocal, seventy-eight percent of mobile local searches result in an offline purchase within twenty-four hours. Tracking the organic traffic behind those searches — not just overall site visits — is what connects the dashboard to actual revenue.
6:38 Small Business vs. Enterprise Dashboard
The metrics in a small business dashboard and an enterprise dashboard are identical — rankings, traffic, calls, conversions. What is completely different is the data architecture behind them. A small business dashboard covers one location and two or three conversion types, built in a few hours. An enterprise dashboard covers thirty-plus locations, each with its own service area, multiple service lines, a CRM integration, role-based access, and automated market-level alerts — built correctly over four to eight weeks.
7:12 Build Sequence: Client Dashboard Setup
When building a dashboard for clients, prioritize data connections by business impact. Start with call tracking and form submissions — these answer the revenue question immediately. Connect GA four and Search Console next, both using native Looker Studio connectors that take less than one hour. CRM integration comes third — it takes longer but produces the attribution data that makes the entire dashboard defensible at the executive level. Rank tracking and competitive data come last. Clients get enormous value from the first three layers while final connections are still being validated.
7:49 Executive View: What Leadership Actually Needs
Executives need four things and four things only. Total organic traffic versus last month and last year. SEO-attributed leads versus target. The top three ranking improvements and the top three declines. And one key insight with a recommended action. Everything else lives one click deeper for marketing managers and SEO specialists. Configure automated alerts so executives get notified about significant traffic drops or conversion declines without logging in manually. When the right people see the right data in sixty seconds, the SEO program gets the internal resources it needs to keep growing.
8:26 Maintenance: Four to Six Hours Per Client Monthly
Maintenance is not overhead — it is what keeps the entire system earning its place in the monthly retainer. Plan for four to six hours per client per month. Check all data connections weekly. Update the reporting hierarchy immediately when a client adds service lines or acquires new locations. Review alert thresholds quarterly so a twenty-percent traffic drop alert calibrated in January still makes sense in July. Run a data accuracy audit monthly by spot-checking five to ten metrics against their source platforms. Catch drift early before it becomes a report executives stop trusting.
8:60 Timeline to Build Enterprise Dashboard Right
A well-structured enterprise SEO dashboard takes four to eight weeks to build correctly. Week one covers architecture planning, hierarchy definition, and tool selection. Weeks two and three handle data connection setup, call tracking configuration, CRM integration, and conversion event implementation. Week four builds dashboard design, executive views, and role-based access controls. The final phase covers testing, validation, and documentation. Rushing this process produces a dashboard that looks complete but reports inaccurate data — and inaccurate data erodes client trust faster than no dashboard at all.
9:42 Stop Hiding Behind Blended Averages
Your current reporting may be hiding the market-level insights that matter most. PushLeads builds custom enterprise SEO dashboards for businesses in Asheville and the surrounding region — location-level clarity, revenue attribution, and automated alerts that keep your team focused on what is actually moving the needle. Get your free SEO teardown at the link in the description, or call eight two eight, three four eight, seven six eight six.
What Makes an Enterprise SEO Dashboard Different from Standard Tools?
An enterprise SEO dashboard differs from standard tools because it segments performance by location, service line, and business unit instead of rolling everything into a single total. Standard SEO client dashboards hide problems that segment-level data reveals immediately. When everything rolls up to one number, you miss the Phoenix location dropping from position three to position twelve while Denver climbs to position one.

The core challenge is not data volume. It is segmentation. A restoration company with 30 locations needs to see how Denver performs versus Phoenix. They want service line comparisons and market-level insights, not a blended average that obscures what is actually happening in each market.
Enterprise clients operate multiple distinct business units. Each unit has different conversion paths, customer values, and competitive dynamics. Your dashboard must reflect these business realities, not force everything into a single view. Companies using segmented performance dashboards identify growth opportunities 47% more effectively than those viewing consolidated data alone. For SEO programs managing millions in revenue, this difference drives budget allocation and strategic decisions that move the needle.
What’s an SEO client dashboard versus an enterprise SEO dashboard?
An SEO client dashboard is any reporting view you share with a client. It might show traffic, rankings, and a few conversion events. An enterprise SEO dashboard is a structured data system built around your client’s business hierarchy. It connects multiple data sources, supports role-based access, and reports outcomes by business unit, not just by website. The distinction matters when you have 10 or more locations, multiple service lines, or a franchisor-franchisee reporting relationship. At that scale, a basic client dashboard creates more confusion than clarity.
Why does consolidated data hide real performance problems?
When a strong market and a weak market average together, the result looks fine on paper. A national chain with 20 locations might show steady organic traffic overall while five markets are quietly losing ground to local competitors. Without location-level segmentation, no one catches those five markets until the damage is significant. Blended totals also obscure service line performance. A water damage restoration company might see commercial jobs decline while residential jobs climb, keeping the total flat. Segment-level data surfaces these shifts in time to act on them.
Want more customers from Google & AI search?
Get a free SEO audit of your site — see exactly what to fix first.
What Should an SEO Dashboard for Enterprise Operations Actually Track?
An SEO dashboard for enterprise operations needs to track metrics that connect organic search directly to business outcomes, not just traffic and rankings. Most dashboards stop at impressions and clicks. Enterprise dashboards go further, tying every organic session to a lead, a call, a closed deal, and a revenue number your CFO can act on.
Here is what separates an effective SEO dashboard for enterprise use from a basic reporting setup:
- Location-level rank tracking tied to geographic coordinates, not national averages. Position three for “water damage restoration” in Asheville, NC means something entirely different than position three in a rural market with a fraction of the search volume.
- Conversion data by market showing which locations generate the most leads from organic traffic and which ones need attention. Without this layer, you make budget decisions based on incomplete information.
- Revenue attribution by channel connecting organic traffic to closed deals through your CRM. This answers the question every executive eventually asks: what did SEO actually produce this quarter?
- Competitive share of voice by location showing how your visibility compares to direct competitors in each market, not just your overall domain authority or link profile.
- Technical health scores monitored automatically so crawl errors, page speed regressions, and indexing problems surface before they cost you rankings.
When you build an SEO dashboard for enterprise operations with these tracking layers in place, you stop reporting on activity and start reporting on outcomes. That shift changes how leadership views the SEO program and how confidently they invest in it going forward.
What revenue metrics belong in an enterprise SEO dashboard?
Connect organic traffic to pipeline value and closed revenue through your CRM integration. Track cost per organic lead by location, organic lead close rate compared to paid and referral channels, and average job value generated from organic traffic. These numbers justify SEO budget at the executive level better than any ranking report. When you can show that organic leads close at a higher rate and cost 40% less than paid leads, the conversation shifts from “how much does SEO cost” to “how do we invest more in what’s working.” Build these metrics into the dashboard from day one rather than trying to reconstruct them later.

What Core Components Does an Enterprise SEO Dashboard Need?
An enterprise SEO dashboard needs four foundational components: location-specific rank tracking, multi-system data integration, custom attribution models, and automated anomaly detection. Standard dashboards skip all four. Here is what each one does.
- Location-specific rank tracking shows keyword positions tied to geographic coordinates. Tools like BrightLocal and Local Falcon track rankings by specific location, giving you the market-level clarity that blended national data never provides.
- Multi-system data integration connects SEO metrics to business outcomes. Your dashboard pulls from Google Analytics 4, Search Console, call tracking platforms, CRM systems, and franchise management software. This integration reveals the complete customer journey from search to closed sale.
- Custom attribution models connect organic traffic to revenue. A commercial client might have customers who find them organically, call an 800 number, get transferred to regional offices, and complete jobs weeks later. Standard attribution misses this complexity entirely.
- Automated anomaly detection alerts you when traffic drops 20% week-over-week or top keywords fall out of position ten. At enterprise scale, manual monitoring becomes impossible, and problems compound quickly when no one catches them early.
How does Schema.org structured data connect to enterprise dashboard reporting?
Schema.org structured data markup on your pages supports rich results in Google Search, and those rich results affect click-through rates that show up directly in your Search Console data. When you implement LocalBusiness, Service, and Review schema correctly across enterprise locations, you can track rich result impressions and click-through rates by location inside your dashboard. This gives you a direct connection between technical implementation decisions and the traffic numbers your executives watch. Track schema coverage as a health metric alongside crawl errors and page speed scores.
What call tracking setup does an enterprise dashboard require?
Configure separate dynamic number insertion pools for each location using CallRail or CallTrackingMetrics. Each pool assigns unique tracking numbers to organic visitors in that market, so calls attribute correctly to the location and keyword that drove them. Map call outcomes, including answered, booked, and qualified status, back to the organic session that generated the call. According to BrightLocal, phone calls remain the primary conversion action for local service businesses, which means accurate call tracking is not optional for enterprise local SEO reporting. It is the core of revenue attribution.
What Goes Into a Technical SEO Dashboard at Enterprise Scale?
A technical SEO dashboard monitors site health across all enterprise properties automatically and alerts your team before issues become ranking problems. At enterprise scale, a single crawl error or JavaScript rendering failure across thousands of pages can cost significant organic traffic before anyone notices manually.
Your technical SEO dashboard should track these metrics continuously:
- Crawl coverage and indexation rate by section of the site. Know how many pages Google has crawled versus how many are indexed, and flag gaps that indicate crawl budget problems or noindex tags applied incorrectly.
- Core Web Vitals by page template, not just site-wide averages. A slow category page template affects thousands of URLs. Google’s PageSpeed Insights API feeds this data into your dashboard automatically.
- Structured data error rates pulled from Search Console’s Rich Results report. Track which location pages have valid LocalBusiness markup and which have validation errors.
- Redirect chain depth across the site. Enterprise sites accumulate redirects over years of migrations and redesigns. Chains longer than two hops waste crawl budget and dilute link equity.
- Internal link distribution showing which pages receive the most internal links and which priority pages are orphaned. At enterprise scale, internal linking is a significant ranking lever that most teams ignore.
- Log file data from your server showing how Googlebot actually crawls your site versus how you expect it to behave. This data catches crawl budget waste that Screaming Frog misses.
How do you surface technical SEO issues before they cost rankings?
Set threshold-based alerts at the metric level, not just weekly report delivery. When your indexed page count drops more than 5% in a seven-day window, that alert should fire the same day. When Core Web Vitals scores for your highest-traffic page templates cross into the poor range, your technical team needs to know immediately. According to Search Engine Land, sites that catch and resolve technical issues within 48 hours of detection recover rankings significantly faster than those that identify problems only during monthly reporting cycles. Build your alert logic around business impact, not just technical thresholds.
How to Create an SEO Dashboard for Clients with Advanced Tracking
To create an SEO dashboard for clients, start with conversion measurement configuration before anything else. Enterprise clients have complex sales paths that standard tracking misses entirely. Getting this step right from the beginning means you report real business impact from day one, not scramble to reconstruct historical data after the dashboard is already live.
Call tracking integration through CallRail or CallTrackingMetrics captures phone conversions by location. Configure separate tracking numbers for each market to maintain attribution accuracy. Businesses using attribution-connected call tracking see 28% improvement in ROI measurement versus tracking call volume alone.

Form submission tracking through GA4 requires conversion event configuration for each lead type. Configure separate events for quote requests, emergency service calls, and consultation bookings so your client sees which lead types organic traffic actually produces in each market.
CRM integration passes lead source data into your dashboard. Most enterprises use Salesforce or HubSpot with APIs that connect to Looker Studio through Supermetrics or custom connectors.
Revenue attribution connects closed deals back to organic traffic sources. This data answers the CFO question: what did we get from SEO this year? Configure this connection early because historical data reconstruction becomes complex and time-consuming once you are months into the engagement.
Configure your local SEO tracking to feed location-specific data into the dashboard. When Dallas improves from position nine to position three while Houston stays at position twelve, your client sees exactly where to focus budget and where to investigate what is holding performance back.
How do you create an SEO dashboard for clients on a tight timeline?
Prioritize your data connections in order of business impact. Start with call tracking and form submissions because those metrics answer the revenue question immediately. Connect Google Analytics 4 and Search Console next since both use native Looker Studio connectors that take less than an hour to configure. CRM integration comes third. It takes longer to build but produces the attribution data that makes the entire dashboard defensible at the executive level. Rank tracking and competitive data come last. A client can get enormous value from the first three layers while the final connections are still being built and validated.
How do you handle clients who switch CRM platforms mid-engagement?
Document every data connection and custom formula in a separate configuration file from day one. When a client switches from HubSpot to Salesforce, you need to know exactly which API fields map to which dashboard metrics so you can rebuild the connection without losing historical context. Build your dashboard to pull from an intermediate data layer in BigQuery whenever possible. When the CRM changes, you update the BigQuery pipeline rather than rebuilding the entire dashboard. This architecture adds setup time upfront but saves significant work every time a client’s software stack evolves.
How to Create an SEO Client Dashboard with Executive Views
To create an SEO client dashboard that works for everyone in the organization, build separate views for executives, marketing managers, and SEO specialists. Each group needs a different level of data depth. Executives want 60-second summaries. Marketing managers need detailed filtering. SEO specialists require raw data access and technical metrics. Forcing all three groups into the same view means none of them gets what they actually need.
Build an executive summary page showing four key metrics:
- Total organic traffic versus last month and last year
- SEO-attributed leads versus target
- Top three ranking improvements and declines
- One key insight with a recommended action
Everything else supports these four points. The detailed data lives one click deeper, available for managers who need granular analysis without cluttering the executive view with numbers they do not have context to interpret.
Configure role-based access controls so executives see summary dashboards, marketing managers get full filtering capabilities, and SEO teams access raw data exports and technical metrics. Set up automated alerts for traffic drops exceeding 20% week-over-week, top-ten keywords falling below position twenty, and conversion rate declines greater than 15% from baseline. When problems surface automatically, your team responds faster and your clients stay informed without needing to request updates.
This structure is what separates a dashboard clients reference every week from one they look at once and forget. When the right people see the right data in a format that matches their role, the SEO program gets the internal attention and resources it needs to keep growing.
What makes customizable SEO dashboards worth the extra build time?
A customizable SEO dashboard lets you match the reporting structure to how the business actually measures success, not how a default tool template happens to organize data. A home services company measures success by booked jobs per market. A SaaS company measures it by organic trial signups by product line. A franchise system measures it by location-level ranking share versus the competition. When you build a customizable dashboard around those actual success metrics, clients engage with the data because it answers their real questions. Generic templates answer generic questions. Custom dashboards answer the specific questions that drive budget decisions and strategic direction.
Enterprise SEO Dashboard Tool Selection: What Actually Works
Choose your tools based on data complexity, not features you assume you will need. Google Looker Studio works for most enterprise reporting needs because it is free, scales effectively, and connects to necessary data sources through native connectors or third-party tools like Supermetrics. Starting with the simplest tool that handles your requirements keeps your dashboard maintainable and your costs predictable.
| Tool | Best For | Cost Level | Technical Requirement |
|---|---|---|---|
| Google Looker Studio | Most enterprise reporting, GA4 and Search Console integration | Free | Low to moderate |
| BigQuery | Complex integrations combining SEO with CRM or call center data | Usage-based | Moderate to high |
| BrightEdge / Conductor | Automated monitoring for large SEO programs | Several thousand per month | Moderate |
| Tableau / Microsoft Power BI | Extremely complex data relationships, clients with data scientists on staff | Licensing required | High |
| BrightLocal / Local Falcon | Location-level rank tracking for multi-location and franchise clients | Low to moderate | Low |
For clients already using Google products, Looker Studio integrates directly with GA4, Search Console, Google Ads, and Google Business Profiles. The platform handles significant data volume and supports complex segmentation through calculated fields. BigQuery serves as an intermediate data layer when combining SEO data with non-Google sources like CRM platforms, call centers, or franchise management systems. Plan your tool stack during the architecture phase so you are not retrofitting connections after the dashboard is live and clients are depending on it for weekly decisions.
How do SEO companies structure dashboards for their own agency reporting?
Agencies managing multiple clients need a dashboard structure that separates client data completely while letting internal teams see performance patterns across accounts. Build a master agency view that tracks aggregate metrics like average client ranking improvement, total organic leads delivered across accounts, and retention indicators by account. Keep each client’s data in isolated Looker Studio reports with separate data source connections. This protects client confidentiality and prevents accidental cross-contamination of data. Use a consistent template structure across all client dashboards so your team can navigate any account efficiently without relearning the layout each time.
How to Tailor Dashboards for Franchise SEO
To tailor dashboards for franchise SEO, use a location-first reporting hierarchy that shows individual market performance at the top and rolls up to regional and national totals. This structure gives franchisors and franchisees each the data relevant to their decisions without forcing them to dig through numbers that do not apply to their role. It also prevents a strong market from masking a weak one inside blended totals that look healthy on the surface.
Franchise dashboards need these specific configurations:
- Separate rank tracking by geographic coordinates for each franchise location using BrightLocal or Local Falcon
- Individual call tracking numbers per market to maintain accurate attribution across locations
- Role-based access so individual franchisees see only their location data while the franchisor sees all markets and can compare performance side by side
- Side-by-side location comparisons showing which markets are improving, which are declining, and where budget reallocation makes the most sense
- Alerts configured at the location level, not just the national level, so a single underperforming market triggers attention before it becomes a larger problem
Franchise management software often produces data that needs to connect to your enterprise SEO dashboard through BigQuery or Supermetrics. Plan this integration during your architecture phase, not after the dashboard is already built and clients are expecting clean data. Getting the data pipeline right from the start saves significant time and prevents the reporting gaps that erode client trust over a long engagement.
How do you show franchisors vs. franchisees different data from the same dashboard?
Build two distinct report layers in Looker Studio from the same underlying data sources. The franchisor view shows all locations in a sortable comparison table, regional rollups, and market share trends across the full system. The franchisee view filters automatically to their single location using a URL parameter or a login-based data credential. Franchisees see their own rankings, calls, and conversion data alongside a benchmark showing how they compare to the system average without exposing specific competitor franchise data. This structure answers each group’s actual questions without requiring separate dashboard builds for every location in the system.
Can a Customizable SEO Dashboard Work for Small Business?
A customizable SEO dashboard works for small businesses when you scale the complexity to match the actual reporting need. A single-location plumber does not need a BigQuery pipeline or role-based access controls. They need to see how many calls came from organic search this month, which keywords drove those calls, and how their Google Business Profile rankings changed in their service area. You can build that dashboard in Looker Studio in a few hours using GA4, Search Console, CallRail, and BrightLocal as data sources.
The value of a customizable dashboard for small business is not the complexity. It is the specificity. A generic dashboard template shows site-wide traffic. A custom small business dashboard shows traffic from within a 20-mile service radius, calls from mobile organic visitors, and GBP view counts by day of week. Those metrics answer the questions a small business owner actually asks. According to BrightLocal’s Local Consumer Review Survey, 78% of local searches on mobile result in an offline purchase within 24 hours. Tracking the organic traffic behind those searches, not just overall site visits, gives small businesses the visibility data that actually connects to revenue.
In this video
- 0:00 SEO Dashboard Features That Prove Revenue
- 1:47 Why Most SEO Dashboards Fail ROI
- 2:36 Core Dashboard Features Every Business Needs
- 3:26 Click-Through Rate Your Biggest Quick Win
- 4:11 Enterprise vs Small Business Dashboard Requirements
- 5:04 Segmentation Turns Data Into Decisions
- 6:03 Choosing the Right SEO Dashboard Tool
- 6:55 Vanity Metrics to Remove From Your Dashboard
- 7:50 Connecting Dashboard Data to Real SEO Work
- 9:34 Setting Up a Dashboard You Will Actually Use
- 11:17 Tracking AI Overviews as a Visibility Layer
- 12:00 FAQs on SEO Dashboard Best Practices
What’s the difference between a small business SEO dashboard and an enterprise one?
The difference is hierarchy and integration depth, not the underlying metrics. Both dashboards track rankings, traffic, calls, and conversions. A small business dashboard does this for one location with one service area and two or three conversion types. An enterprise dashboard does it for 30 locations, each with its own service area, multiple service lines, a CRM integration, and automated alerts by market. The metrics are the same. The data architecture behind them is completely different. Start with the version that fits your current complexity and build toward enterprise architecture as your location count and reporting requirements grow.
How Do You Maintain an Enterprise SEO Dashboard Over Time?
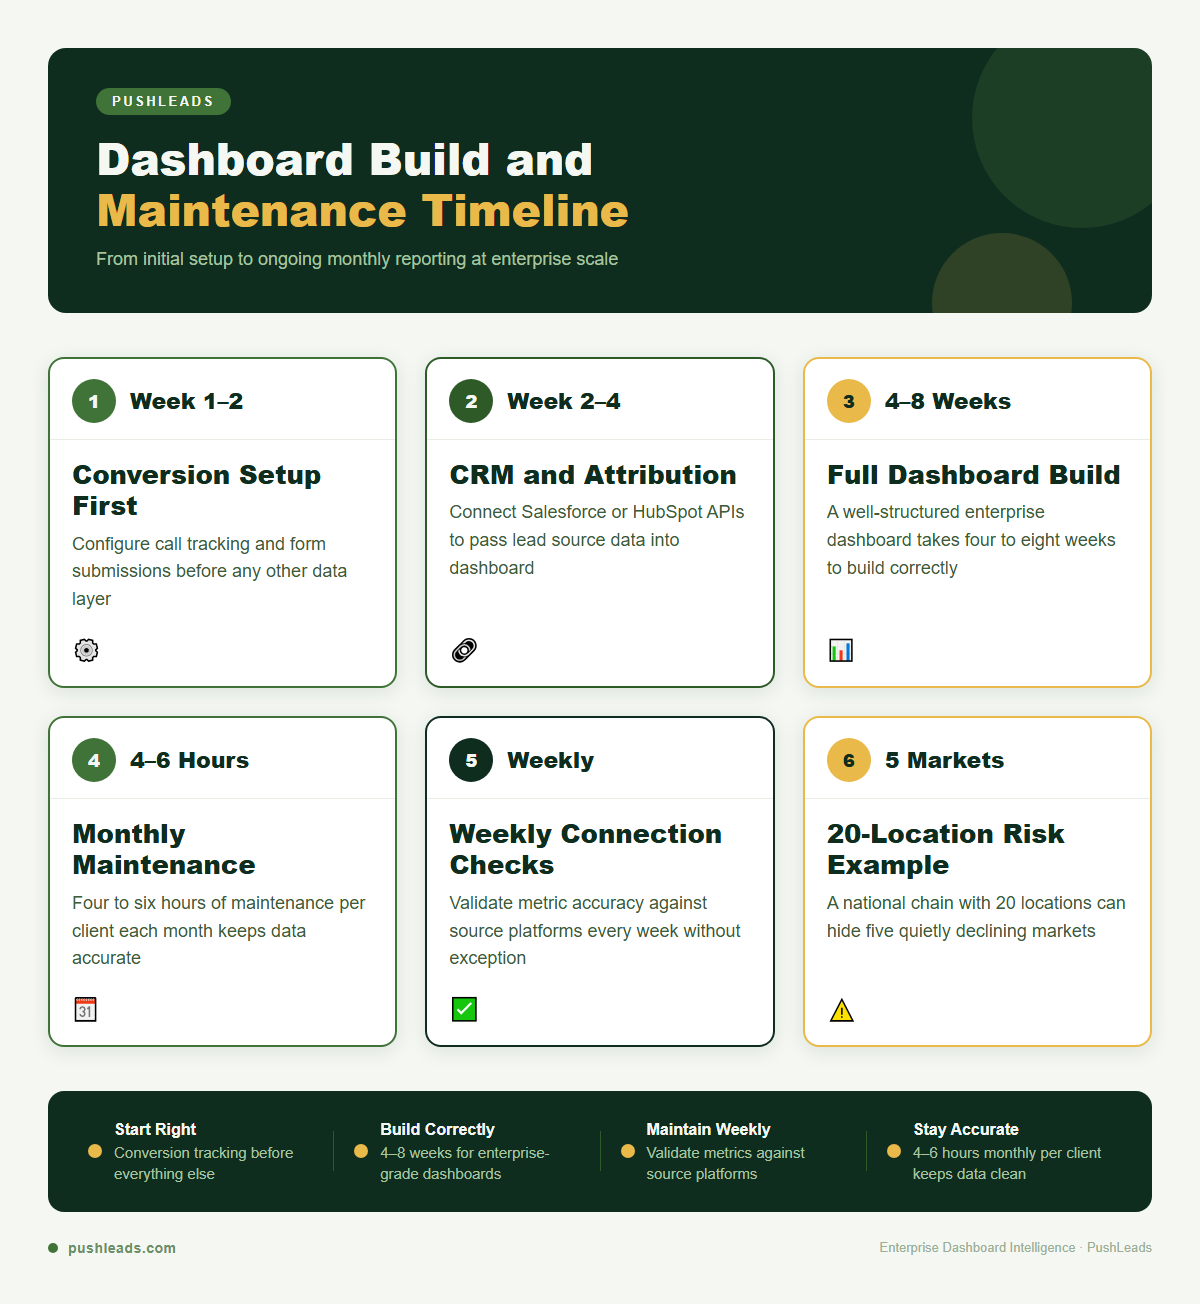
Enterprise SEO dashboards require four to six hours of maintenance per client each month because API connections break during platform updates, data sources change when clients switch software systems, and reporting hierarchies shift during business reorganizations. Build this time into your enterprise retainer pricing from day one. Treating maintenance as an afterthought leads to dashboards that show stale or inaccurate data, which undermines the trust you worked to build.
Key maintenance tasks include:
- Checking all data connections weekly and validating metric accuracy against source platforms. Confirm GA4 traffic matches dashboard traffic and that Search Console impressions align with rank tracking data.
- Updating dashboards as businesses evolve. When a client adds three new service lines or acquires two franchises, the reporting hierarchy needs to reflect that change immediately.
- Reviewing alert thresholds quarterly. A 20% traffic drop alert that fires constantly due to normal seasonality creates alert fatigue. Calibrate thresholds based on actual historical patterns.
- Documenting all data connections, custom formulas, and configuration settings so your team can work efficiently when personnel changes happen on either side of the engagement.
- Running a data accuracy audit monthly by spot-checking five to ten metrics against their source platforms. Catch drift early before it compounds into reports that executives stop trusting.

When maintenance is done consistently, your enterprise SEO dashboard stays accurate, your clients stay confident, and your reporting continues to drive the decisions that grow their business. Maintenance is not overhead. It is what keeps the entire system earning its place in the monthly retainer.
How do you handle dashboard accuracy when a client migrates their website?
Treat a website migration as a dashboard migration event and plan for it explicitly. Before the migration goes live, document all existing conversion events, URL structures, and data source configurations. After launch, immediately check that GA4 is firing on the new site, that Search Console is verified for the new domain or URL structure, and that call tracking numbers are still resolving correctly. Give yourself a 30-day window to validate that the new data matches expected patterns before presenting it to executives. Site migrations routinely break reporting configurations that looked fine during staging but fail in production.
Frequently Asked Questions
What is an enterprise SEO dashboard and how is it different from a standard SEO report?
An enterprise SEO dashboard is a live, connected reporting system that segments performance by location, service line, and business unit, then ties that data to revenue through CRM and call tracking integrations. A standard SEO report shows traffic and rankings at a site-wide level. An enterprise dashboard shows how the Denver market performs versus Phoenix, which service lines generate leads, and what organic search produced in closed revenue this quarter. The difference is structural. Enterprise dashboards are built on a data architecture that reflects how the business actually operates, not how a reporting tool organizes information by default.
Which tools work best for building a custom SEO dashboard at enterprise scale?
Google Looker Studio handles most enterprise reporting needs and works well for businesses using GA4, Search Console, Google Ads, and Google Business Profiles. It is free and supports complex segmentation through calculated fields. For clients who need to combine SEO data with CRM platforms or franchise management systems, BigQuery serves as the data layer connecting everything before it flows into Looker Studio. BrightEdge and Conductor are purpose-built enterprise SEO platforms worth evaluating for very large programs. Tableau and Microsoft Power BI work for organizations with data scientists on staff. Start with the simplest tool that meets your actual requirements before adding complexity.
How do you create an SEO client dashboard that executives will actually use?
Build a dedicated executive summary page showing four things: total organic traffic versus last month and last year, SEO-attributed leads versus target, the top three ranking improvements and declines, and one key insight with a recommended action. Keep this page clean and focused on what leadership cares about. Put granular data one click deeper so marketing managers and SEO teams can access it without cluttering the executive view. Configure automated alerts so executives get notifications about significant traffic drops or conversion declines without logging in manually. When structured this way, executives reference the dashboard regularly because it answers their questions in 60 seconds or less.
How long does it take to set up an enterprise SEO dashboard from scratch?
A well-structured enterprise SEO dashboard takes four to eight weeks to build correctly, depending on data complexity and how many systems need to connect. The first week covers architecture planning, hierarchy definition, and tool selection. Weeks two and three focus on data connection setup, call tracking configuration, CRM integration, and conversion event implementation. Week four handles dashboard design, executive view creation, and role-based access. The final phase covers testing, validation, and documentation. Rushing this process produces dashboards that look complete but report inaccurate data. Getting the architecture right from the start saves significant rework and keeps clients confident in the numbers they use for decisions.
What is a technical SEO dashboard and which metrics should it track?
A technical SEO dashboard monitors site health automatically across all enterprise properties. It tracks crawl coverage and indexation rates by site section, Core Web Vitals scores by page template, structured data error rates from Search Console’s Rich Results report, redirect chain depth, internal link distribution to priority pages, and Googlebot crawl patterns from server log files. The goal is surfacing issues before they cost rankings. According to Search Engine Land, sites that catch and resolve technical issues within 48 hours recover rankings significantly faster than those identifying problems only during monthly reporting cycles. Set threshold-based alerts, not just scheduled report delivery.
How do you tailor dashboards for franchise SEO reporting?
Use a location-first reporting hierarchy with individual market performance at the top, rolling up to regional and national totals. Configure separate rank tracking by geographic coordinates for each location, individual call tracking numbers per market, and role-based access so franchisees see only their data while franchisors see all markets. Build side-by-side location comparisons so franchisors can identify underperforming markets quickly. Set alerts at the individual location level, not just the national level. Integrate franchise management software through BigQuery during the architecture phase, not after the dashboard is already live and clients are depending on accurate data.
Can PushLeads build a custom SEO dashboard for my business?
Yes. PushLeads builds custom enterprise SEO dashboards for businesses in Asheville, NC and the surrounding region. We start with your reporting hierarchy and business structure, then connect your data sources, configure call tracking and CRM integrations, and build executive and manager views that give every level of your organization the information they need. We also handle ongoing maintenance so your dashboard stays accurate as your business grows and your software stack evolves. If you’re managing multiple locations or service lines and your current reporting hides what’s actually happening in each market, contact us to build a system that shows the real picture.
Do customizable SEO dashboards make sense for small businesses?
Yes, when you scale the complexity to match the actual need. A single-location service business needs to see organic calls by week, GBP ranking positions in their service area, and which keywords drive booked jobs. You can build that dashboard in Looker Studio using GA4, Search Console, CallRail, and BrightLocal in a few hours. The value is specificity, not complexity. A custom small business dashboard answers the owner’s actual questions: how many calls did I get from Google this month, and are my local rankings improving? Generic templates answer generic questions. Custom dashboards answer the ones that connect directly to revenue.
Build an Enterprise SEO Dashboard That Shows Real Results
Your current reporting may be hiding the insights that matter most. An enterprise SEO dashboard built on the right architecture gives you location-level clarity, revenue attribution, and the automated alerts that keep your team focused on what is actually moving. See exactly where your visibility stands with a free teardown at seo.pushleads.com/audit or call 828-348-7686.
Keep Reading
Want more customers from Google & AI search?
Get a free SEO audit of your site — see exactly what to fix first.
Your path · SEO Dashboard Metrics Guide
7 articles. About 135 minutes.
 Technical SEO Dashboards: Site Health Monitoring Guide
- Up nextHow Do You Present SEO Data to Clients Who Hate Numbers?
- Real-Time SEO Monitoring: What Your Dashboard Should Track in 2026



Want this done for you?
Scan your site. See the gaps. Decide with numbers.
- Rankings, Google Business Profile and site-speed teardown
- Report lands in your inbox in about a minute
- No obligation · 4.9 from 67 Google reviews
 Continue to Part 6
